| Personal Budget | |||||||||||
|
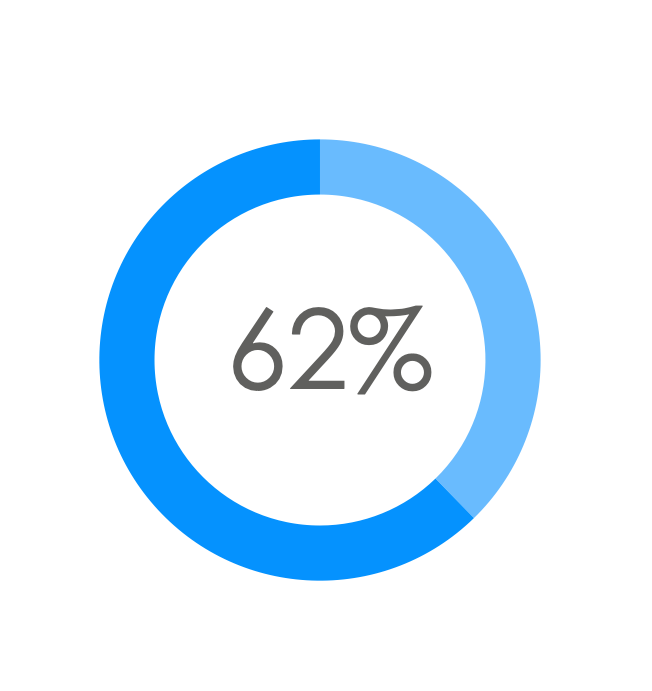
Percentage of Income Spent | Summary | |||||||||
| TOTAL MONTHLY INCOME | 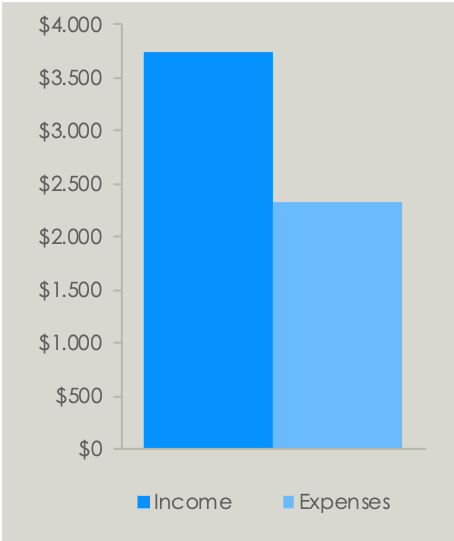
|
||||||||||
| $3.750 | |||||||||||
| TOTAL MONTHLY EXPENSES | |||||||||||
| $2.336 | |||||||||||
| TOTAL MONTHLY SAVINGS | |||||||||||
| $550 | |||||||||||
| CASH BALANCE | |||||||||||
| $864 | |||||||||||
| Monthly Income | Monthly Expenses | Monthly Savings | |||||||||
| ITEM | AMOUNT | ITEM | DUE DATE | AMOUNT | DATE | AMOUNT | |||||
| Income Source 1 | $2.500,00 | Rent/mortgage | [Date] | $800,00 | [Date] | $200,00 | |||||
| Income Source 2 | $1.000,00 | Electric | [Date] | $120,00 | [Date] | $250,00 | |||||
| Other | $250,00 | Gas | [Date] | $50,00 | [Date] | $100,00 | |||||
| Cell phone | [Date] | $45,00 | |||||||||
| Groceries | [Date] | $500,00 | |||||||||
| Car payment | [Date] | $273,00 | |||||||||
| Auto expenses | [Date] | $120,00 | |||||||||
| Student loans | [Date] | $50,00 | |||||||||
| Credit cards | [Date] | $100,00 | |||||||||
| Auto Insurance | [Date] | $78,00 | |||||||||
| Personal care | [Date] | $50,00 | |||||||||
| Entertainment | [Date] | $100,00 | |||||||||
| Miscellaneous | [Date] | $50,00 | |||||||||